2019 MLB Model Postmortem
A little over a year ago I built a model to bet on MLB baseball based on Trading Bases by Joe Peta. Long story short: I used Baseball Prospectus and Fangraphs pre-season win totals as a baseline, adjusted each side for the starting pitchers, announced starting lineup and home field advantage to create a win expectancy for each team in every game, then compared that to the implied odds in the markets. Where there was a discrepancy, the system would text me with which team was the play and how large the wager should be based up the size of the discrepancy. Things started so well:
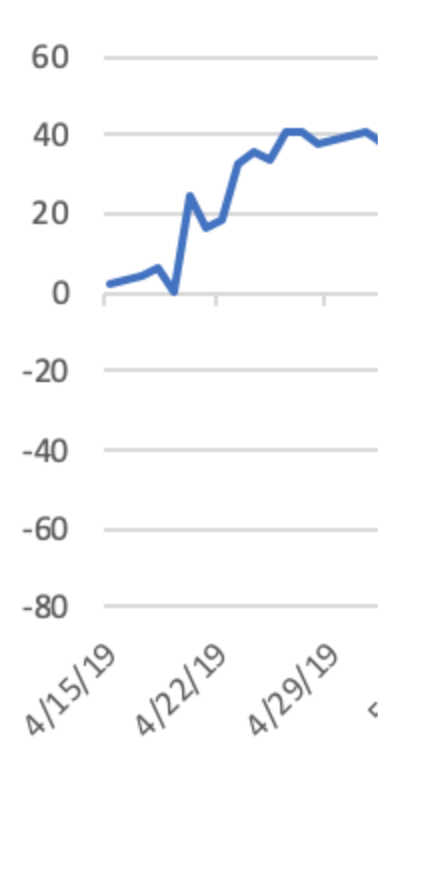
I was up 40 units in the first couple weeks! So if I had been betting $100/game, I’d have been up $4k. In reality I was betting just a couple of bucks, but I was still stoked. Unfortunately, by late May it was all gone and I was back to my original balance.
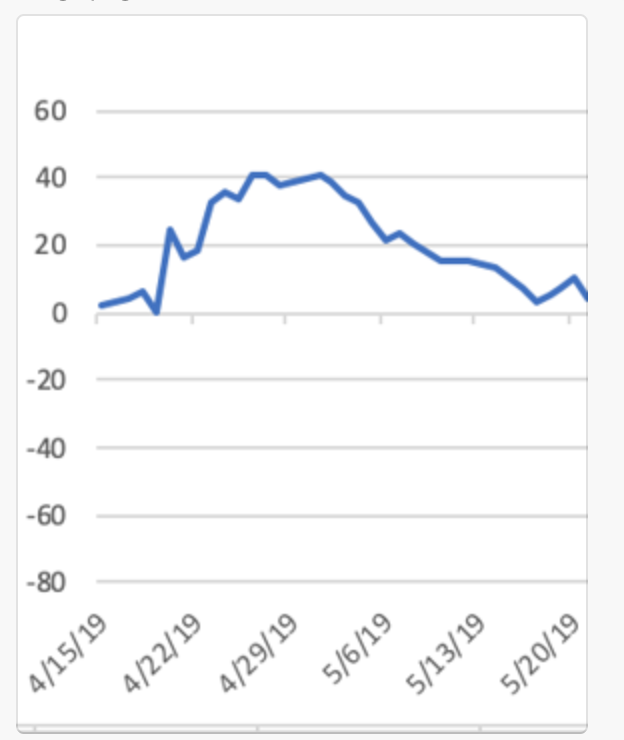
At this point I lost my nerve and stopped betting, but I left the model running. It would still text me every time it found an “edge”, and I was archiving all the data throughout the season. Recently I have been digging through that data. Here’s how it would have worked out if I’d bet the whole season:

Down almost 60 units! Not great! Again, that’s $6k if I was betting $100/game. What went wrong??? I started digging through all the data collected over the course of the season, plus augmenting with some other data sets. I had INTENDED the model to be self-correcting, as in I had baseline win expectancy for each team and I’d give more weight to what had actually happened throughout the season over the original baseline.
TURNS OUT: I was completely ignoring what had actually happened throughout the year, so I was just multiplying the remain winning percentage by 162 games, so it was all model and no reality. What does that mean?
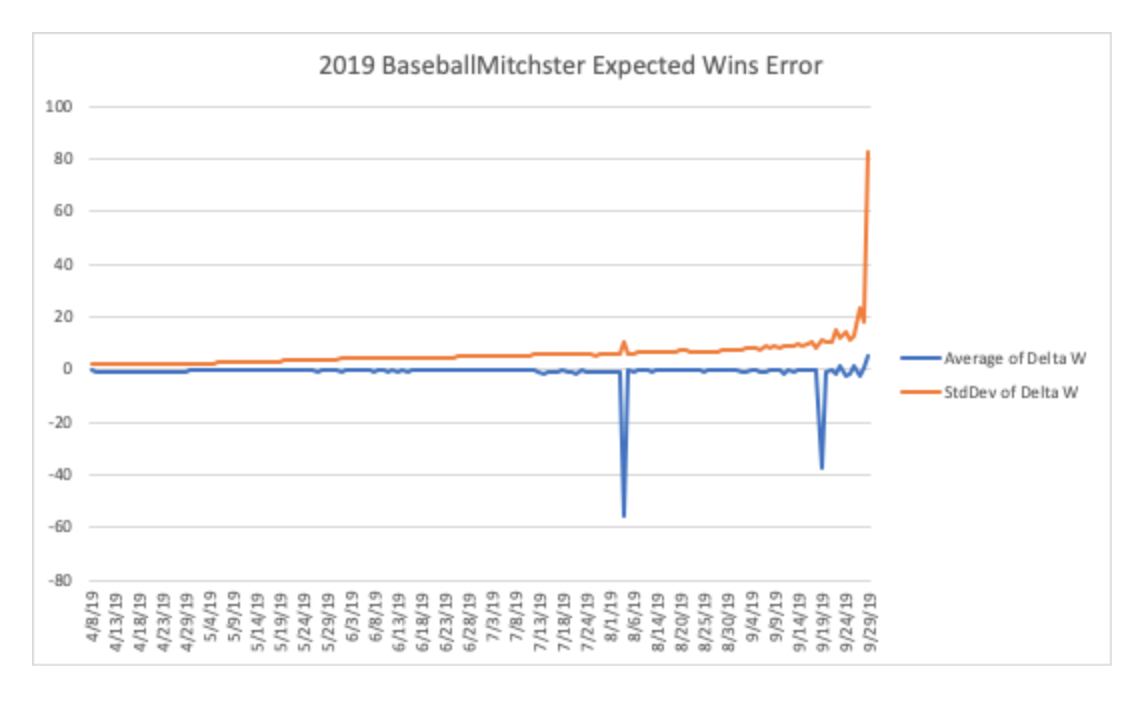
The blue line is the average delta between the win expectancy of my model that was determining bets, and what I WANTED to use in the model. Overall, not very far off when averaged. HOWEVER, the standard deviation gets out of hand pretty quickly. So much so that on the last day of the season, my model predicted that every team was either a 162-0 or a 0-162 team with a standard deviation of 81 games!
Back to the drawing board. I have about 240k data points throughout the 2019 season, so I was able to go back and simulate a corrected model to do what I had originally intended to to do.

The MLB updated their site about 3 weeks before the end of the season that broke my scraper, but at that point I would have been up 200 units, or $20,000 on $100 bets!
My original model excluded 4 teams that were expected to be historically bad (and were), but the revised model still included them. Teams that bad break things because they seem to have value, but win so infrequently they never payoff the advantage.
One thing you’ll see from the revised chart is reduced returns starting in earyly June. I have included closing line value (CLV) on the full season charts. That’s the difference between the odds you buy at and the final odds at start time. Closing odds tend to be VERY accurate as they represent the most market information. If you get better odds than the market, you have captured more value. If your odds are worse, it indicates enough other people think your bet was wrong and move the market away from you. CLV is good proxy for how you are doing in spite of things like small smalL sample size and luck. Here’s the original model’s performance including CLV as well.

Early in the season, my model seemed to have a better grasp of how good teams were and I had great closing line value. However, after a few weeks, the market seemed to have caught up and my CLV was about zero.
One weakness (and strength) of the model is that it waits until all the players are announced before recommending bets. While this gives very accurate predictions, it means that lines have been open a long time with lots of opportunity for the market to be corrected. Lineups used to be announced willie-nillie, but last year MLB made a rule that lineups had to be sent to the league 15 minutes before announced publicly so that the league can share with “data partners” these partners share the data with sports books as well, which gives them a heads up.