I was sick for a couple of weeks, a few weeks back. Even after I felt “healthy” it has taken some time to feel like I’m myself. I had a hard time concentrating on anything for more than 12-20 minutes at a time and was very easily distracted. At the time, this didn’t really bother me. Given everything else that’s happening in the world, I cut myself some slack.
Starting late last week, I found myself more easily frustrated. For the first time in a long time, I was finally able to concentrate and think at a level that felt right. However, distractions still abound. We’re all still getting used to spending every hour of every day with our family. Distractions that break my flow are frustrating me.
I don’t want to be frustrated with my family. They don’t mean to do it. But again, I’m going to cut myself some slack. I think this frustration that I’m feeling is actually good. It means I’m truly starting to get my brain back to where I want and expect it. As it gets stronger, I’ll be able to deal with the distractions better.
In the meantime, I’m going to try to produce something every day*. Whether it’s a short post like this, or a daily web comic strip, just something. Anything.
Yesterday, I dug up some old emails/slack threads about the postmortem I did on my first baseball model. I have some posts that I’ve been drafting for a while I’ll finish and publish. Like most of my posts, I probably won’t be happy with them and may intend to come back and revise later. Like most of my posts, I probably won’t actually do it.
There are some specific topics I want to write about, but don’t feel like I have the capacity to write them as well as I think they deserve. So, I’ve stubbed them out in draft state and will come back to them when I’m more confident.
*I’ll probably publish most week days. May not do so one weekends.
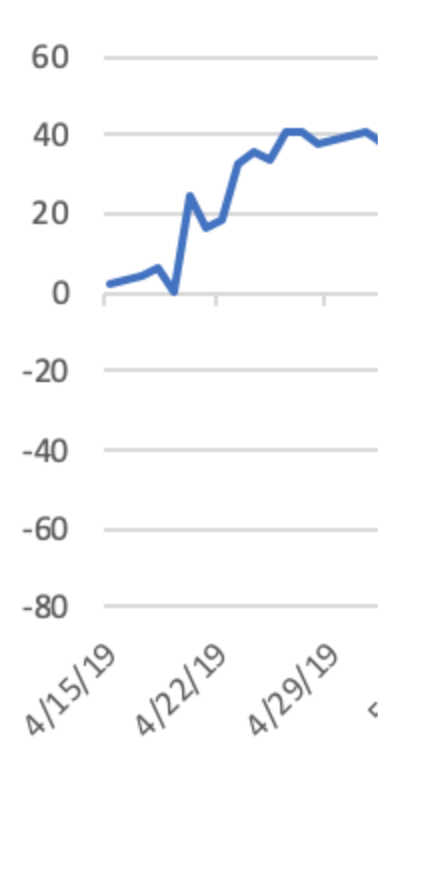
A little over a year ago I built a model to bet on MLB baseball based on Trading Bases by Joe Peta. Long story short: I used Baseball Prospectus and Fangraphs pre-season win totals as a baseline, adjusted each side for the starting pitchers, announced starting lineup and home field advantage to create a win expectancy for each team in every game, then compared that to the implied odds in the markets. Where there was a discrepancy, the system would text me with which team was the play and how large the wager should be based up the size of the discrepancy. Things started so well:
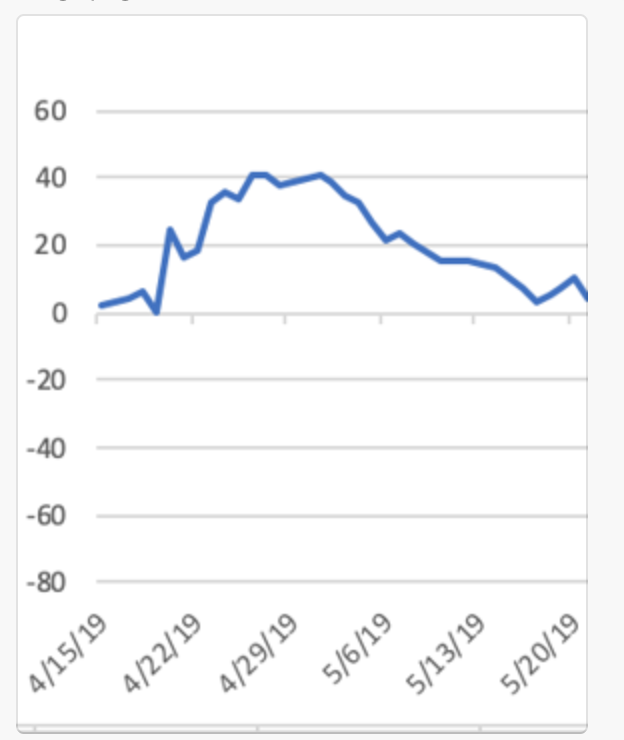
I was up 40 units in the first couple weeks! So if I had been betting $100/game, I’d have been up $4k. In reality I was betting just a couple of bucks, but I was still stoked. Unfortunately, by late May it was all gone and I was back to my original balance.
At this point I lost my nerve and stopped betting, but I left the model running. It would still text me every time it found an “edge”, and I was archiving all the data throughout the season. Recently I have been digging through that data. Here’s how it would have worked out if I’d bet the whole season:
Down almost 60 units! Not great! Again, that’s $6k if I was betting $100/game. What went wrong??? I started digging through all the data collected over the course of the season, plus augmenting with some other data sets. I had INTENDED the model to be self-correcting, as in I had baseline win expectancy for each team and I’d give more weight to what had actually happened throughout the season over the original baseline.
TURNS OUT: I was completely ignoring what had actually happened throughout the year, so I was just multiplying the remain winning percentage by 162 games, so it was all model and no reality. What does that mean?
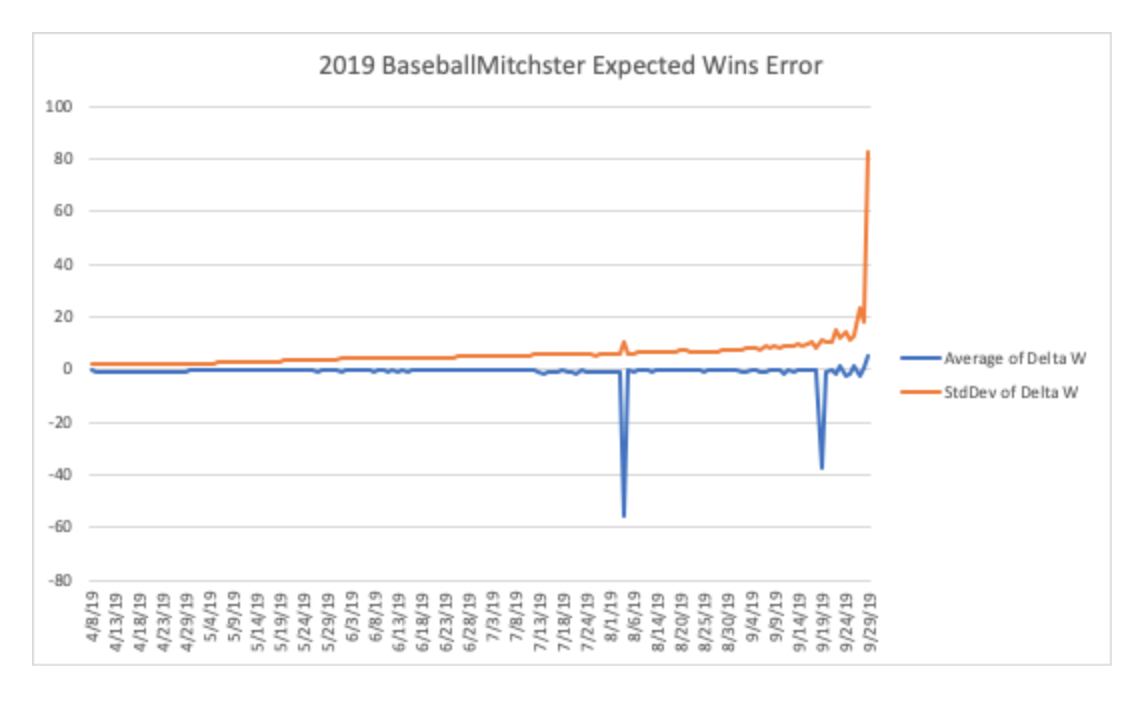
The blue line is the average delta between the win expectancy of my model that was determining bets, and what I WANTED to use in the model. Overall, not very far off when averaged. HOWEVER, the standard deviation gets out of hand pretty quickly. So much so that on the last day of the season, my model predicted that every team was either a 162-0 or a 0-162 team with a standard deviation of 81 games!
Back to the drawing board. I have about 240k data points throughout the 2019 season, so I was able to go back and simulate a corrected model to do what I had originally intended to to do.
The MLB updated their site about 3 weeks before the end of the season that broke my scraper, but at that point I would have been up 200 units, or $20,000 on $100 bets!
My original model excluded 4 teams that were expected to be historically bad (and were), but the revised model still included them. Teams that bad break things because they seem to have value, but win so infrequently they never payoff the advantage.
One thing you’ll see from the revised chart is reduced returns starting in earyly June. I have included closing line value (CLV) on the full season charts. That’s the difference between the odds you buy at and the final odds at start time. Closing odds tend to be VERY accurate as they represent the most market information. If you get better odds than the market, you have captured more value. If your odds are worse, it indicates enough other people think your bet was wrong and move the market away from you. CLV is good proxy for how you are doing in spite of things like small smalL sample size and luck. Here’s the original model’s performance including CLV as well.
Early in the season, my model seemed to have a better grasp of how good teams were and I had great closing line value. However, after a few weeks, the market seemed to have caught up and my CLV was about zero.
One weakness (and strength) of the model is that it waits until all the players are announced before recommending bets. While this gives very accurate predictions, it means that lines have been open a long time with lots of opportunity for the market to be corrected. Lineups used to be announced willie-nillie, but last year MLB made a rule that lineups had to be sent to the league 15 minutes before announced publicly so that the league can share with “data partners” these partners share the data with sports books as well, which gives them a heads up.
Lower the barrier to writing so that I’d write more frequently
I chose the Academic theme because it seemed good for a “personal brand”. It’s pretty fast pagespeed-wise, with the sacrifices in the name of a nice design. Hugo (via markdown) has been great for lowering the friction on writing.
I wanted to make the site faster, so I spent some time trying to optimize an older version of the theme for speed to decent success. However, whenever I’d upgrade the theme I’d lose some of the speed I’d gained.
I started to look to re-optimize the latest version of the theme, but given it’s reliance third-party JS, Bootstrap and Google-fonts, there was always going to be a ceiling on how fast I could make the site go. Since the greatest advantage of the Academic theme for me was “personal brand building”, which wasn’t even one of my objectives, ran counter to one of my actual objectives (speed), here’s what I did:
While Commento may slow the site down slightly, I’ve gotten decent engagement on one post via organic search. Disqus is awful in both user privacy and site speed (Pagespeed scores of ~30 for mobile). The results for mobile page speed scores:
Overall, I am very happy that I moved from WordPress to a static site on Hugo. I also think the Academic theme is a great personal site theme and I’m alway stumbling on new people using it. However I’ve run into two really frustrating issues that I hope that I have resolved for good:
I following the recommended installation instructions of building with one click on Netlify, but when I would clone the project locally, it would not install the theme submodule. This would prevent my local hugo sever from building until I hackishly downloaded a local copy of the them myself.
Similarly, due to my hacked setup, updating the theme proved impossible. Both times that I have updated the theme I did so by setting up fresh versions of the repo then re-loading content from the last version. Not ideal.
I think I have resolved both problems just by learning git a little better. This time after creating a fresh version of the repo with the latest theme, I cloned with the --recurse-submodules flag. This brought down the theme files from the start and my local hugo server built no problem. Plus I think this will allow me to use the theme’s update instructions.
Update
I successfully updated the theme for the first time without having to just rebuild all the content against a fresh site skeleton. Steps:
Ran git submodule update --remote --merge then had to add themes folder in git
Applied all the breaking and config changes
Upgraded Hugo on my local machine
Resolved an issue in a template change that I had overridden
The first update still took a bit longer to execute than I had hoped, but mostly that was due to the learning curve and updating multiple versions and having to apply multiple blocks of breaking/config changes.
Recently, I updated up just a single version by:
Navigated to the theme directory via cd themes/academic
Checked out the specific version (in this case 4.8.0) with git checkout v4.8.0
Applied the breaking and config changes for the newest version
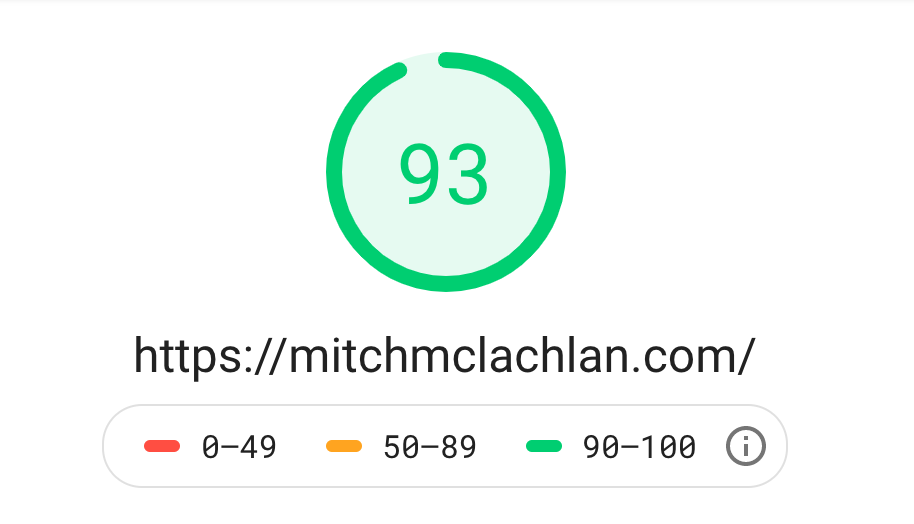
When I first migrated my personal site from Wordpress to Hugo one of my goals was to make the site fast. Because Hugo serves my pages as static content, there is no waiting for things like servers looking up content in a database. And while my Google Pagespeed score jumped right away, I wanted to get as close to 100 as I could, especially on mobile. Site speed, and user experience in general, has become more important in ranking in Google, and really has become table stakes. If I’m going to go to the trouble of generating content, I might as well do my best to make sure that user experience is optimized.
Initial Approach
The first time I tackled this process, I just worked through the Google Pagespeed Insights tool’s recommendations, tackling the opportunities with the greatest potential impact first. I made great progress by hacking my way through the template files and was able to lock in a desktop score of 100 and mobile score of 97.
97 Mobile Speed Score Audit Results
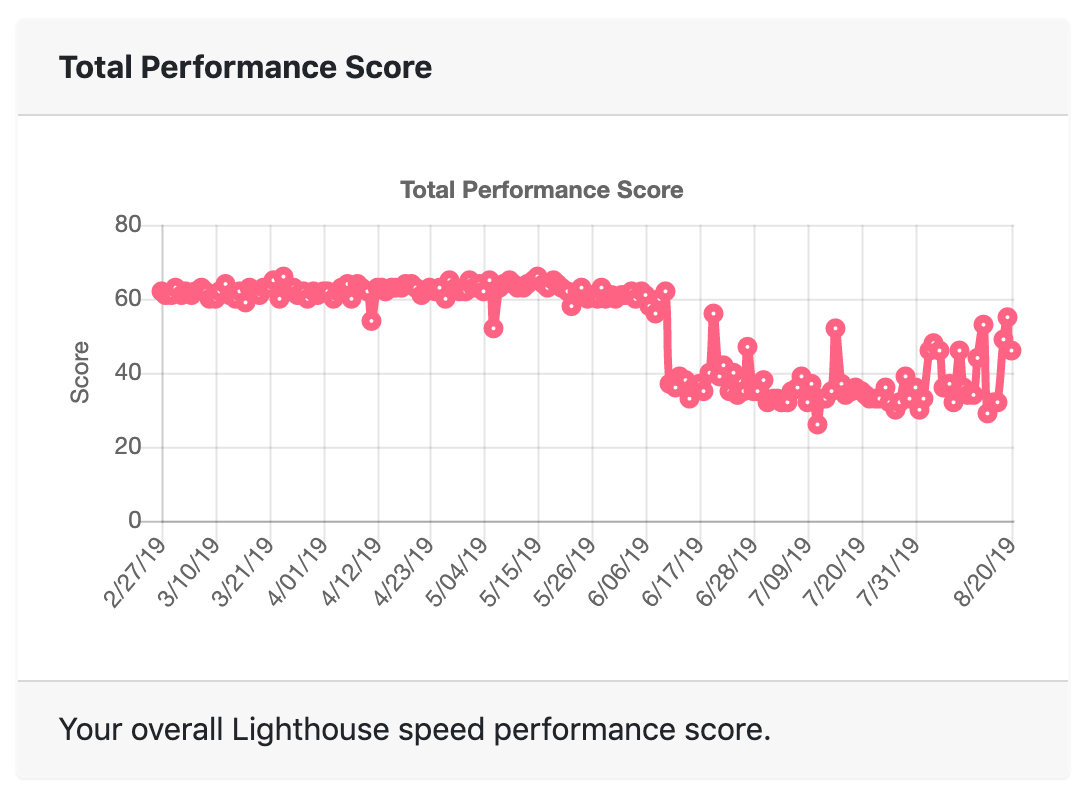
I then found SpeedMonitor.io which tracks my score over time and emails me whenever my scores drop to a threshold I’ve set. Which now happens every day:
Speed Score Over Time
The two sustained drops, at May 21 and August 15, correspond to the two times I updated to the latest version of the Academic theme. Due to issues I had while attempting the upgrades, I ended up creating fresh copies of the kickstart project and just repopulating with my existing content. Along the way, I did not bring over those speed optimizations, which would just get blown away in future updates.
A (Hopefully) Better approach
I now know how to build locally using the theme as a submodule. I also know how to override the theme files instead of hacking them directly. This should make applying future theme updates much easier AND allow me to preserve any theme customizations, such as this pagespeed optimization. Just in case, I’ll document the process here in case I ever have to do it again.
Baseline for Academic 4.4
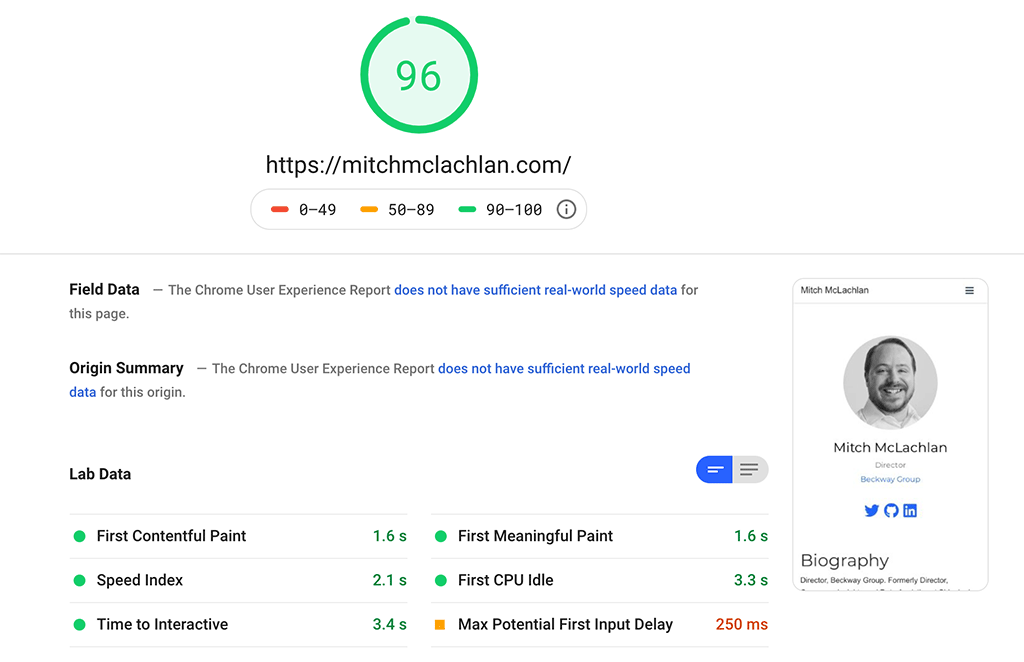
After upgrading to the latest version of the theme, my initial mobile speed score is 89 and my desktop score is 98. Pretty good, thanks to 19 passed audits.
Properly size images
Defer offscreen images
Minify CSS
Minify JavaScript
Remove unused CSS — Potential savings of 17 KB
Efficiently encode images
Serve images in next-gen formats — Potential savings of 14 KB
Enable text compression
Preconnect to required origins
Server response times are low (TTFB) — Root document took 30 ms
Avoid multiple page redirects
Preload key requests
Use video formats for animated content
Avoids enormous network payloads — Total size was 460 KB
Uses efficient cache policy on static assets — 3 resources found
Avoids an excessive DOM size — 463 elements
User Timing marks and measures
JavaScript execution time — 0.8 s
Minimizes main-thread work — 2.0 s
I think some of this is due to the theme itself being optimized over time, but a thanks to me optimizing images the first time I undertook this project. The only opportunity recommended is to eliminate render-blocking resources, which took me some time to figure out last time. I should be able bang this out pretty quickly. Here are the resources I need to address:
I used the scripts from GiftOfSpeed to defer. Last time, I just hacked the template directly, in this case, themes/academic/layouts/partials/footer.html. This time I’ll override by creating this folder structure at the root of my project:
layouts
_default
…and then copying in the baseof.html file from the same location in the themes/academic directory. As you can see, the template file structure has changed slightly since my first optimization project. I will also need to find where these files are being referenced today so that I can see how they are being called with Go. Here’s how the call is structured in themes/academic/layouts/partials/site_head.html:
{{ if and (fileExists (printf "static/css/vendor/%s" ($scr.Get "vendor_css_filename"))) (fileExists (printf "static/js/vendor/%s" ($scr.Get "vendor_js_filename"))) }}
  {{ $scr.Set "use_cdn" 0 }}
  <link rel="stylesheet" href="{{ printf "/css/vendor/%s" ($scr.Get "vendor_css_filename") | relURL }}">
{{ else }}
  {{ $scr.Set "use_cdn" 1 }}
  {{ printf "<link rel=\"stylesheet\" href=\"%s\" integrity=\"%s\" crossorigin=\"anonymous\">" (printf $css.academicons.url $css.academicons.version) $css.academicons.sri | safeHTML }}
  {{ printf "<link rel=\"stylesheet\" href=\"%s\" integrity=\"%s\" crossorigin=\"anonymous\">" (printf $css.fontAwesome.url $css.fontAwesome.version) $css.fontAwesome.sri | safeHTML }}
  {{ printf "<link rel=\"stylesheet\" href=\"%s\" integrity=\"%s\" crossorigin=\"anonymous\">" (printf $css.fancybox.url $css.fancybox.version) $css.fancybox.sri | safeHTML }}

  {{/* Default to enabling highlighting, but allow the user to override it in .Params or site.Params.
       Use $scr to store "highlight_enabled", so that we can read it again in footer.html. */}}
  {{ $scr.Set "highlight_enabled" true }}
  {{ if isset .Params "highlight" }}
    {{ $scr.Set "highlight_enabled" .Params.highlight }}
  {{ else if isset site.Params "highlight" }}
    {{ $scr.Set "highlight_enabled" site.Params.highlight }}
  {{ end }}
  {{ if ($scr.Get "highlight_enabled") }}
    {{ $v := $css.highlight.version }}
    {{ with site.Params.highlight_style }}
      {{ printf "<link rel=\"stylesheet\" href=\"%s\" crossorigin=\"anonymous\" title=\"hl-light\">" (printf $css.highlight.url $css.highlight.version .) | safeHTML }}
      {{ printf "<link rel=\"stylesheet\" href=\"%s\" crossorigin=\"anonymous\" title=\"hl-dark\" disabled>" (printf $css.highlight.url $css.highlight.version .) | safeHTML }}
    {{ else }}
      {{ if eq ($scr.Get "light") true }}
        {{ printf "<link rel=\"stylesheet\" href=\"%s\" crossorigin=\"anonymous\" title=\"hl-light\">" (printf $css.highlight.url $css.highlight.version "github") | safeHTML }}
        {{ printf "<link rel=\"stylesheet\" href=\"%s\" crossorigin=\"anonymous\" title=\"hl-dark\" disabled>" (printf $css.highlight.url $css.highlight.version "dracula") | safeHTML }}
      {{ else }}
        {{ printf "<link rel=\"stylesheet\" href=\"%s\" crossorigin=\"anonymous\" title=\"hl-light\" disabled>" (printf $css.highlight.url $css.highlight.version "github") | safeHTML }}
        {{ printf "<link rel=\"stylesheet\" href=\"%s\" crossorigin=\"anonymous\" title=\"hl-dark\">" (printf $css.highlight.url $css.highlight.version "dracula") | safeHTML }}
      {{ end }}
    {{ end }}
  {{ end }}
  {{ if or (eq site.Params.map 2) (eq site.Params.map 3) }}
  {{ printf "<link rel=\"stylesheet\" href=\"%s\" integrity=\"%s\" crossorigin=\"anonymous\">" (printf $css.leaflet.url $css.leaflet.version) $css.leaflet.sri | safeHTML }}
  {{ end }}

  {{ if eq site.Params.search.engine 2 }}
    {{ printf "<link rel=\"stylesheet\" href=\"%s\" integrity=\"%s\" crossorigin=\"anonymous\">" (printf $css.instantsearch.url $css.instantsearch.version) $css.instantsearch.sri | safeHTML }}
    {{ printf "<link rel=\"stylesheet\" href=\"%s\" integrity=\"%s\" crossorigin=\"anonymous\">" (printf $css.instantsearchTheme.url $css.instantsearchTheme.version) $css.instantsearchTheme.sri | safeHTML }}
  {{ end }}

{{ end }}
The important bit for our first optimization is this line:
Which is wrapped in an if/else statement. For now, I’ll create a stripped down version of this block and have only my fontawesome line in there for now. I’ll also include variable assignments that are referenced in that block. This will all be inserted right above the closing </body> tag. That looks like this:
Lastly, I need to copy over the source of this code, the theme’s site_head.html into the root level layouts/partials/ override folder, and comment out the font awesome line:
My local dev server builds fine, but let’s deploy these changes and see what happens to the production site…
Mobile Speed Score Jumped by 4 points!
BUT I’m not doing anything fancy here. I’m just loading that css at the very end of the file. Now that I know that my overrides work, I’ll apply the GiftOfSpeed script:
Success. Everything built properly and fontawesome is being loaded correctly and my mobile speed score crept up to 94. I will quickly do the same for my other resources.
After I moved 4 CSS links to the giftofspeed script and uncommented the links in the head but wrapped them in a noscript tag, I was able to achieve a mobile seed score of 96!
Mobile Speed Score Jumped to 96!
I’m really close to being back where I was 3 months ago on mobile speed score. HOWEVER, it’s not all sunshine and rainbows. While I optimized to a metric, I also just hurt usability for actual visitors. Why? Well even though my site loads faster now, the content presentation has taken a hit, including Flash of Unstyled Content. I’ll come back next and clean that up with some critical styles. One other thing that needs to be addressed is that the theme itself has a fade in transition. While it may be aesthetically pleasing, it does artificially delay the presentation. The first time I did this exercise, I found where that was set and disabled it.
Optimizing Posts: Don’t Use Disqus
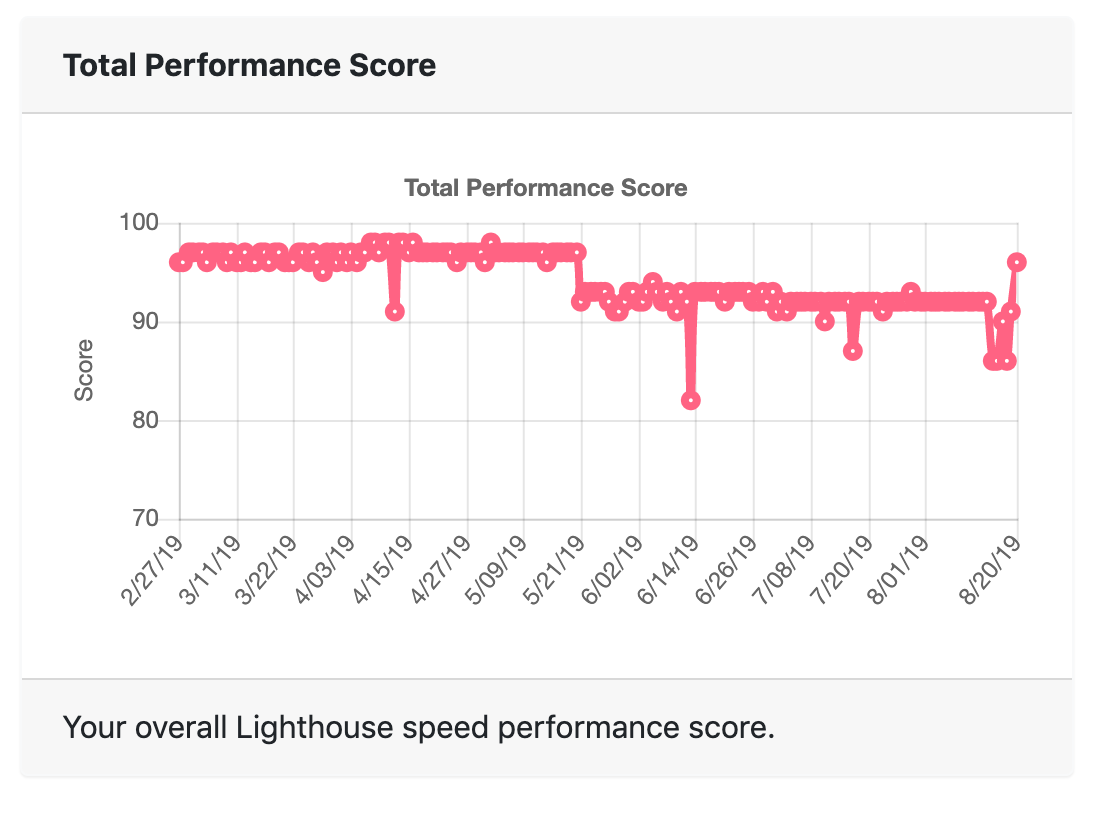
The above has been focused on the home page and global performance. However, most of my content is blog posts. I’ve been using SpeedMonitor to track a couple of posts over time as well. Here’s one of my first posts:
Comments Good. Disqus Bad.
This particular post has not been optimized yet. Honestly, it hasn’t even been finished yet. So it has never had a great mobile speed score due to an extraneous video embed and lots of images. However, you can see a big drop on June 11. Prior to that, the page had a mobile speed score in the low 60s. Since, it’s averaged a score in the upper 30s. So what’s going on? That’s when I enabled Disqus for commenting. There are plenty of resources out there explaining why you should avoid Disqus. By switching to Commento, I increased my mobile pagespeed score for this post from 41 to 88. Since this page is already getting decent organic search traffic, I’m interested to see the potential impact of this change.
Critical Path CSS
Critical Path CSS is styles you load up front while all your other style loading is being deferred. The idea is that you load all the styles you need for the initial page view so there is no flash. It’s not perfect, but here’s my critical path CSS as of now; there’s probably some blog post styles I need to work on.
I’ve put this in a file called critical_path.css in a new folder assets/css in the site’s root folder, and then let the builder know of it’s existence by referenceing it in _default/params.toml in this line:
I’ve been reading a lot of books about sports analytics lately. My current read is The Logic of Sports Betting by Ed Miller and Matthew Davidow. One of the first concepts discussed in the book is understanding the balanced hold of a sportsbook on a two-way market. In a two-way market, you take either one side of a bet or the other, for example Team A will win, or Team B will. The hold is simply the profit a book “holds” onto after all of the winning bets have been paid, divided by the total wagers placed. A balanced hold assumes (naively) that the book is holding balanced action on the wagers, meaning that no matter which side wins, the book will have the same amount of profit. This is rarely realty for a number of reasons. However, the concept is emphasized as important, presumably because it will be needed for later concepts. While a couple of contrived examples are presented, the how of to calculate the balanced hold is not spelled out—at least in the chapters I’ve read thus far.
I wanted to be able to quickly calculate the hold myself, so I tried a few unsuccessful Google searches. So in about 15 minutes I figured out how to calculate it myself, first via doing the math on paper, then building a spreadsheet calculator to make it easier to calculate on the fly as needed.
Here’s some examples laid out in the book in American Odds:
Example 1
Team A
Team B
Odds
-150
+130
Wagers Placed
$150.00
$108.69
Potential Payout
$100.00
$141.30
Potential Profit(Losing Wager Kept minus Winning Bet Payed Out)
$8.69
$8.70
Balanced Hold(Payout divided by total wagers taken)
3.4%
3.4%
The last part, calculating the hold percentage is the easiest: you just divide the profit by total money wagered. The harder part is to figure out what the profit and amount wagered need to be in order for the action to be balanced. For that to happen, we need to have the amount paid to each possible winner subtracted from the amount wagered by the respective loser to be equal. For example 1 that looks like:
Profit from Team A winning = Wagers placed on Team B minus payout on Team A wagers = $108.69 - $100.00 = $8.69
Profit from Team B winning = Wagers placed on Team A minus payout on Team B wagers = $150.00 - $141.30 = $8.70
Profit from Team A winning = Profit from Team B winning
The way I tackled this problem was to start with calculating the wager to payout ratio for each bet. Since we’ll need to be calculating both the wager and payout amounts, we need this ratio to solve later variables. I won’t go into how dumb American odds are, but a quick overview of what they represent. If a wager’s odds are negative (-150), that means you have to risk $150 to win $100. If a wager’s odds are positive (+130), then if you wager $100 you will receive the odds ($130) back. Therefore, in example 1, the ratio of wager to payout for each bet is:
Example 1
Team A
Team B
Odds
-150
+130
Wagers Placed
$150.00
$100.00
Potential Payout
$100.00
$130.00
Payout-to-Wager Ratio
0.667
1.3
You can do this in a spreadsheet formula would look something like this:
=IF(odds<0, 100/ABS(odds), ABS(odds)/100)
In order to solve the problem, I started by assigning an arbitrary wager and payout for one side of the bet. In this case, I just set side A with potential payout of $100, so risking $150. If it was a plus bet, I’d set it to risk $100 and payout to the odds. The formula for the risk would look like:
=IF(odds<0, ABS(odds), 100)
Then for the payout you would just multiply your risk to the ratio calculated above.
Example 1
Team A
Team B
Odds
-150
+130
Wagers Placed
$150.00
X
Potential Payout
$100.00
Y
Payout-to-Wager Ratio
0.667
1.3
Potential Profit
$?
$?
Balanced Hold
?%
?%
Since our objective is to have the profit for both columns to be equal, we can setup the equation like this:
Wagers placed on Team B minus payout on Team A wagers =
  Wagers placed on Team A minus payout on Team B wagers

X - 100 = 150 - Y
Since previously calculated the ratio between X and Y, we can replace Y with a factor of X:
Y = 1.3X
X - 100 = 150 - 1.3X
Now we can solve for X:
2.3X - 100 = 150
2.3X = 250
X = 108.6956...
Y = 1.3X = 141.3043...
Let’s plug in these new values for wagers and payouts on Team B, and calculate the profit on each outcome:
Example 1
Team A
Team B
Odds
-150
+130
Wagers Placed
$150.00
$108.70
Potential Payout
$100.00
$141.30
Payout-to-Wager Ratio
0.667
1.3
Potential Profit
$8.70
$8.70
Balanced Hold
3.4%
3.4%
Success! If you aren’t interested in recreating this yourself, you can just grab a copy of my Balanced Sportsbook Hold Calculator Google Sheet.
Multi-way Markets
I was feeling super proud of myself until I got to the next chapter, which spelled out how it’s equally important, but much harder, to calculate a multi-way market. A two-way market takes the form of
Who will win the 2019 NBA Playoffs?
Toronto Raptors
Golden State Warriors
Or How many games will the 2019 Boston Red Sox win?
More than (Over) 94.5
Fewer than (Under) 94.5
A multi-way market has more than two options. Such as:
Result of 2019 Women’s World Cup Match between USA and Thailand:
USA wins
Thailand wins
Tie
Or Who will win the 2019 Women’s World Cup (24 options):
France
USA
Germany
England
Netherlands
Australia
et c.
After much more scratchpad/Google Sheet math, I realized that for each option in a bet, regardless of how many options there were, the sum of the wagers and payouts would be equal. In the example above, the sum of wagers and payouts were both $250. What changed for each option was the ratio of the risk and payout, and that adding the two together was the key. In the example above, the ratio of 1:1.3 became 2.3 when summed. It just so happens that 2.3 is the decimal odds version of a +130 bet. The second tab of my google sheet can calculate the hold on any bet with up to 24 positions.
One of my goals when I migrated my personal site from Wordpress to a static site was to write more often. I was happy with how quickly I was able to bang out a few posts but soon ran out of topics that I wanted to write about. I made a list to hold ideas as they came to me, but I haven’t added anything in months.
I recently came across a question that I couldn’t get answered within a few quick Google searches, so I had to figure it out myself. This happens a couple of times a month, whether because what I’m searching for is novel, or niche, or simply phrased differently from how an expert might approach the topic. Perhaps this presents opportunities to publish content for searches that are result poor, and that can drive some site traffic.
So I decided to dig into my Google search history to see topics that I have searched for in the past, but for which I had to discover the answers on my own. Here’s how:
In the “Select data to include” section, under the “Products” header, click Deselect all
Select “My Activity”, click on the “all activity data selected”, deselect all, then select the products you are interested in. I chose just “Search” for this proof-of-concept, but you may want to also include Books, Image Search, Shopping, Video Search and YouTube
Click on the “Multiple formats” button, and select JSON instead HTML for the “Activity records” option.
Select “Next Step”, one-time export, create archive, you’ll get an email. The default format is HTML, but if you are going to do anything interesting with your data, I recommend selecting JSON as your format.
You’ll receive an email alerting you that a data archive request has been requested, then a second once it’s available for download.
Here’s some simple playing I did as part of the proof-of-concept.
import pandas as pd
from PIL import Image
from wordcloud import WordCloud, ImageColorGenerator
import matplotlib.pyplot as plt
# Read the JSON into a data frame, convert the time column into datetime# and add a flag that distinguishes between searches and other activity.# You could also dump the JSON back to a CSV if you want to analyze in Excel.
activity = pd.read_json('Takeout/My Activity/Search/MyActivity.json')
activity['time'] = pd.to_datetime(activity['time'])
activity['searches'] = activity['title'].apply(lambda x:
'Yes'if x[:13]=="Searched for "else"No")
# Create a temporary copy of the activity DF, but only include# actual searches since the beginning of the year.# Strip off the first 13 chars from the title to leave just the query,# then put the queries in a list.
_ = activity[(activity['searches']=='Yes') &
(activity['time'] >="2019-01-01")].copy()
_['query'] = _['title'].apply(lambda x: x[13:])
queries = list(_['query'])
# Join each query into a single string, then run it through WordCloud.
text =" ".join(query for query in queries)
wordcloud = WordCloud(max_font_size=50, max_words=25,
background_color="white").generate(text)
plt.figure()
plt.imshow(wordcloud, interpolation="bilinear")
plt.axis("off")
plt.show()
wordcloud.to_file("my_search_history.png")
And the result:
Sports, Data, Python, and Grilling. Sounds about right.
A couple of notes:
If you download data from multiple products, they will be zipped up into separate folders by product. You could step through the folders and join them into a single data frame if so inclined, or look at them separately. For instance, if also conduct a lot of YouTube searches looking for “how-to” content. I expect video content for these queries, so I might mine video search and YouTube data for ideas of video content to create, but may not find much blog-worthy ideas there.
I use separate multiple Google accounts: one personal, one each for each business email domain I have. I have created separate Chrome profiles for each account. I can mine my history for each account to find more specific types of activities. For example, the above is from my personal account. But when I look at the search history tied to my main work account, I find a lot more searches about Python, data science, and other platforms my company uses.
Update
It’s been about 6 weeks since I published my first post based on this approach and the results are very encouraging. My organic search sessions are up a whopping 740% period-over-period since. It’s still small potatoes traffic-wise, but I have not done any SEO work other than writing for a topic that I could not find answer for in Google search results.
Organic Search Traffic up 740%
What’s more, I’m ranking in the top 3 for a number of queries that I originally searched for, out-ranking some very established properties and even have my first featured snippet for “calculating sportsbook hold":
Pictured above: 40% of the US squad of the NBA All-Star Game Rising Stars Challenge are on my fantasy team, including mercurial MVP, Kyle ‘The Kuz’ Kuzma.
This will be a ‘living’ post for a bit. I’ll be updating it over time as I make progress on the model. I’ve decide to split the post up into at least 2 parts. This is part one, where I’ll cover how I planned my attack and built my initial model in Google Sheets. I’ll probably publish a cleaned up version of that doc for reference.
Part 2 will cover the migration of the model to Python, including use of the Yahoo Sports API. I’ll likely put the code up on GitHub or the like.
I may tack on more parts later for a retrospective review of performance, lessons learned and updates I’ll be making for next season.
Abstract
Last year I joined a bunch of my old fraternity buddies in the fantasy basketball league that they have been running in some form or another since college.
Once long, long ago I was a huge Pistons fan. However, when I moved to Chicago in 2008 I lost the ability to watch the team regularly. Having grown up in the Bad Boys vs Jordan-coming-of-age era, I couldn’t very well pivot to being a Bulls fan. The ‘Stones also quickly fell from being on the verge of multiple titles to being pathetic. All this combined to make me lose interest in the NBA.
As a result, I felt out of my element as I tried to prepare for my first ever draft last summer.
Sports Modeling Resources
I’ve recently discovered some resources for getting started in building models for sports analytics.
Unfortunately, I did not have these resources last summer. However, each of these are aligned with how my brain goes about solving problems anyway, so I followed the same basic approach from logic. There is a lot of good advice in these resources that I’ll sketch out here as it parallels my own approach, but I recommend you consume them each for yourself.
Problem Statement (Part 1)
So here I am, the new guy prepping for his first draft with zero knowledge of fantasy NBA. Don’t get me wrong, I watch a lot of basketball; it just happens to be college basketball.
I was informed that our particular league generally prescribes to the player valuations of Basketball Monster. I spent a lot of time last summer looking at Basketball Monster’s player valuation projections. While I understood the data, I’m the kind of person that needs to know the why not just the what. I downloaded the data a number of times, sliced, sorted, and highlighted it but never felt more prepared for the rapidly approaching draft.
Other than just looking for value, it bothered me that I couldn’t devise a coherent strategy without the why.
First Attempt
Last spring I read Nate Silver’s The Signal and the Noise. An early chapter covered how he built his own MLB player evaluation model. There isn’t a lot of detail in the book about how his model, PECOTA was built other than:
He built the original model in excel
He built unique age curves for projecting future performance
I did some googling and followed this K nearest neighbors in Python tutorial that focused on NBA players. I learned a bit, but the results were a little underwhelming when the comps for Carmelo and LeBron were Carmelo and LeBron from different years.
Taking Maters Into My Hands
After a number of attempts of downloading and manipulating Basketball Monster’s projections to attempt to create a coherent draft plan, I knew that I needed to build my own model. But how, and what was I trying to accomplish?
Don’t look like an asshole. This was my first rodeo with some old friends. I didn’t want to look like a tourist.
Compete. I’m extremely competitive. I wouldn’t have even joined this league to just hang out.
But how do I compete? I had to look at past league results to wrap my head around what it took to compete for a championship.
If You Wish To Make a Model From Scratch You Must First Invent the Universe
This old Cosmos remix video is always the first thing to come to mind when I start a modeling project. I have a strong suspicion that this is going to be the banner I hold for the foreseeable future BUT in order to create your own model, first you have to build your own universe of known (or at least relevant) data. I had to ping a number of my buddies to find links to past data. I compiled it into a Google sheet like the below. As you’ll see in a later iteration of the model, if you had previous seasons for a league, there are more elegant ways to track down the IDs. While this is fairly extensive list, when I first started on my model, I only had access to the previous 3 years data.
While I could have gone to each page and copy and pasted the tabular results data one at a time, I wanted to make a more sustainable and maintainable model. Given these data links, I was able to use Google Sheets IMPORTHTML function to aggregate historical results. I had some issues with sheets not always being able to consistently get the data out of the Yahoo pages. So when they would load for the first time, I immediately copied and pasted values only in separate sheets to create persistent static copies of the data. In fact, after a system update to Yahoo, the data was being loaded later with javascript, so the IMPORTHTML function stopped working at all. Again, this will not be an issue in later versions of the model.
In our league, the top 4 managers finish ‘in the money.’ Once I had pulled in the data, I wanted to visualize it to understand what each category meant for these money winners.
2017 In The Money Radar Chart
2016 In The Money Radar Chart
2015 In The Money Radar Chart
So What Do We See?
I had heard there was a brief ‘Muck Free Throw’ strategy era, that while registering as inclusive to the ‘in the money’ set, is not correlated to winning the league. I think it had also mostly been abandoned by the period in question. Most obviously, doing poorly in the turnover category is strongly correlated to finishing in the money.
To recap the placing analysis: be good at everything else at the expense of turnovers. This was not an extremely insightful input for my strategy. I knew I’d have to find a means for determining the relative value for each player. My assumption was that this was a case where the value of the whole was equal to the sum of the parts.
So I split out each category’s historical results into their own tabs on my spreadsheet. We’re a 9 cat league, so that meant 9 new sheets for my quickly ballooning ‘model’. Here’s an example of the three seasons of data I had for a single category, Blocks. I captured the season, the team’s rank, the team name, actual totals for the stat, the final roto points that the player received for those stats.
Season
Season Rank
Team
BLK Totals
BLK Points
2017
1
Leonine Facies
681
14
2017
2
Chupacabras
659
13
2017
3
Sorry For Partying
384
2
…
…
…
…
…
2015
12
Chupacabras
457
3
2015
13
the brass rats
428
2
2015
14
The Jabberwocks
468
4
I could use the above to see if I could project roto points to raw stats for a team season. However, my objective is to understand the value of individual players. We have 10 starters in our league, so I divided the season number of stats AND roto points by 10 as two new columns.
Season
Season
Team
BLK Totals
BLK Points
Adj BLK Totals
Adj BLK Points
2017
1
Leonine Facies
681
14
68.1
1.4
2017
2
Chupacabras
659
13
65.9
1.3
2017
3
Sorry For Partying
384
2
38.4
0.2
…
…
…
…
…
…
…
2015
12
Chupacabras
457
3
45.7
0.3
2015
13
the brass rats
428
2
42.8
0.2
2015
14
The Jabberwocks
468
4
46.8
0.4
Now I could see if I could project roto points based on an individual player’s counting stats. To do this in Google Sheets, I plotted the two player-adjusted columns as a scatter plot, added a trend line, and displayed the trend line’s formula and R^2 score.
Pretty good! Strong R^2 score with a simple linear regression. However, I was young and naive way back 8 months ago. When a simple linear function didn’t match as well as my block model, I tried other regressions. Take for instance this simple linear regression for the FT% category:
Honestly, that’s pretty good. But those outliers bugged me since I had already seen the super tight fights for the counting stats. So I tried a polynomial regressor:
Oh, no. There’s a few problems here. First, the R^2 is basically the same as the blocks thanks to the polynomial trend line. That’s great, right?! I now know that this is overfitting. I don’t even need that left outlier point to fit well. It’s terrible and all the other points would lead to a great R^2 with a simple linear regression.
Second, I’ve backed into player values by dividing historical team points by the 10 roster spots afforded. For counting stats, I also divided the stat itself by 10. But for percentages that doesn’t work, so I left that scaled at 1. However, the worst team FT% in the sample was a shade under 65%. However, for the 2017-18 season (the data I was going to use to project values from) a full 21% of the league shot worse that 65%. When you apply my overfit model to that data you’ll find this:
The Dwight Howard Experience
I couldn’t figure out why Basketball Mitchster loved guys like Dwight Howard and Andre Drummond so much more than Basketball Monster. Turns out my overfit regressor, thanks to it’s polynomial function, rewarded poor free throw shooters. A guy who missed all his free throws was more valuable to my model than a guy who made every one. By 400%. IN THE FREE THROW PERCENTAGE CATEGORY. My overall model rewards centers for picking up blocks, which are a very scarce counting stat concentrated in their position group, AND due to overfitting, over values their poor free throw shooting. Here’s what a more reasonable model would have looked like:
Don’t overfit, kids. Basically any player under ~70% FT% should drag down his team’s points.
Once I had found my equations (via the the regression equations from the trendlines in my graphs) I still had to figure out how to correctly model the FG% and FT% categories. While my polynomial regressors were problematic due to overfitting, I wouldn’t know that for months. No, the issue I knew I had to deal with was shot volume.
Say player A is projected to provide 1 roto point for free throw percentage, and another 0.5 points, it would seem putting the two together would lead to 1.5 roto points. For counting stats, this is true. But for percentages, the volume of shots impacts the category greatly because the entire team’s stats are compiled to calculate the percentage.
For instance, let’s say I started my team with just two draft picks, Chris Paul and Dwight Howard:
Chris Paul:
Attempted 221 free throws in the 2017-18 season, the 69th most in the league that season
Made 91.1% of them, tied for 5th in the league for players who attempted more than 10 free throws
Dwight:
Attempted 582 free throws in the 2017-18 season, the forth most in the league that season
Made just 57.4% of them, making him the 443rd worst player by percentage out of 500 players who attempted a free throw that season
So let’s see how these players stack up alone and combined:
Player
FTM
FTA
FT%
Chris Paul
203
221
91.86%
Dwight Howard
334
582
57.39%
‘Team’
537
803
66.87%
Chris Paul is the fifth best free throw shooter in the league AND is top 70 in attempts. BUT Dwight Howard is so bad AND shoots so many more shots, that he drags this lineup down to be on par with the worst shooting team in my sample set.
2018 was a year of firsts for me. This was not happenstance. From January 1, I made a concerted effort push myself to try new things. It was not exactly a resolution, but it was something that I was able to hold myself to all year.
I grew a beard for the first time
I had a beard for the first time, for all of 2018. I had never grown a beard before and I really wanted to see what it was like before I go gray. So I stopped shaving when I broke for Christmas 2017.
I spoke at a conference for the first time
In March I was on a panel for the first time. I’ve wanted to do this for some time. I get a lot of requests to talk but usually turn them down. I finally took broke out of my comfort zone and said yes.
Michigan Marketing Summit 2018
Final Four
I am a Michigan alum and sports fan. I’ve had football season tickets since 1999 and had basketball season tickets while in college. Those were some dark days. I regretted not going to the Final Four in 2013 when a group of my friends went. When Michigan made it to the semis for only the fifth time in my life I really wanted to go. I had a wonderful time even though they lost in the championship game.
Michigan Made the Final Four
Finally found clothes that fit me
I’m a pretty small person, so finding clothes is a huge pain in the ass for me. This year I stumbled upon a local Detroit-based clothing brand called Ash & Erie focused on making clothes for short guys. I’ve gotten to know the guys behind the brand pretty well and I’m loyal customer now.
(My)SQL
I have some database experience. My mobile app uses a SQLite database that I’ve updated over time through clients, imports and querying. I’ve adminned sites before, including the old version of this site, that ran on top of MySQL databases. In the case of WordPress there isn’t much direct manipulation of the DB. But for some other sites with custom CMSs, I had to directly interact with the databases themselves, usually through a GUI. In 2018 I started to do more ecommerce data analysis. At first this required a lot of data exporting from marketing platforms, stitched with custom reports requested from our development team. Eventually they got tired of me asking all time so they set me up with read-only access to our tables and I slowly learned the data structure and MySQL syntax required to get the data I need. Whenever I wanted to look at omnichannel data however, I had to export data out of our ERP for the retail channel and mung it to line up with the ecomm data that I was more familiar with.
My company implemented SalesForce and Marketing Cloud in 2018. We are syncing SalesForce account information over to Marketing Cloud data extensions. This has some advantages, the biggest of which was that I now have access to cross-channel data in a single format and location, and can marry it with marketing data the same platform ecosystem. To do so, I’ve had to learn SQL proper. I’m really quite proud of what I learned last year and impressed with what I was able to create with that knowledge.
I took up rock climbing
I needed a headshot for the conference. It turned out nice, but forced me to recognize that I was the heaviest I had ever been. So I made a conscious effort to lose some weight. I’m fairly certain that I ate more salads in 2018 I had the rest of my life combined. I also wanted to get more active and tried to hit the treadmill 5 days a week. After a few months this got a little boring so I tried to distract myself by listening to podcasts or catching up on TV shows. During the summer I binged the Mission: Impossible films, running harder during the action scenes for some interval training. Ethan Hunt’s various climbing scenes are pretty bad ass, and I have a friend who’s been asking if I wanted to join him at his climbing gym for a while. This seemed like the perfect opportunity to break out of the monotony of the treadmill and push myself further out of my comfort zone. I went about a dozen times in Q4 and even went climbing outdoors.
First time climbing outdoors
Focused on learning
In September, my alma mater announced that alumni could take their online courses for free through Coursera and EdX. After college I worked for at Michigan for a few years on online learning tools. I do a lot of self-directed learning but wanted to try out online learning. The first course I took was Programming for Everybody (Getting Started with Python). I’ve been using Python for a decade, so I knew the course was too rudimentary but I had a few reasons for choosing it:
Low Risk Since it was free for me, I wasn’t worried about the course being a waste of money
Low Barrier Having an existing grasp of the material meant I could focus more on how the Coursera platform works and what it’s like to learn through it.
Nostalgia I created the first online version of this very course in 2008 and the instructor is a former colleague of mine.
It’s been over 5 years since I’ve worked on my site, so it was time for reload. The last iteration of the site was built on WordPress, including a theme I built from scratch (you’ll find a theme here.) It was a lot of work to build the theme, but WP is pretty simple to author content in. I just didn’t have a lot to say.
I chose Hugo as my new platform. It was a rather hasty decision. I had never heard of Hugo until a couple weeks ago when I saw an article come through R-bloggers about rOpenSci using Hugo. I’ve really gotten into data science over the past 12 months and the R-bloggers daily newsletter has made me want to start writing again. I was looking for a lightning fast, easy-to-build and maintain platform that also made authoring as fast as possible. Here are some reason’s Hugo immediately resonated with me:
The content is static and served as HTML immediately at request. WordPress is powered by PHP and MySQL, and has to do a bunch of server-side processing and fetching from databases for every page load. While there are plugins for caching and speed for WP, lightning fast speed is the core feature of static site generators (SSGs) like Hugo. (More on speed later…)
Authoring in Markdown. I’ve used markdown for a few years, and hate WYSIWYG editors, so do most of content authoring in raw HTML. It will take a little time to get used to the formatting for site content instead of marking up things Jupyter Notebooks, Jira tickets or Basecamp posts (though BC dropped MD support some time ago).
I’m already seeing the benefits:
I’ve written something for the first time in 5 years